Instagram DM Automation Metrics to Track
A practical guide to Instagram DM automation statistics: define trustworthy metrics, build a benchmark, and connect replies to qualified leads and revenue.
The most useful Instagram DM automation statistics are the numbers from your own funnel: relevant interactions, messages delivered, replies, consented leads, qualified conversations, and downstream actions. There is no universal reply rate or conversion benchmark that applies to every audience, offer, account type, and message flow.
This guide shows how to build a trustworthy benchmark instead of copying attractive numbers with unclear sources. SocialGrow can help connect Instagram conversations with lead capture, follow-up, source attribution, and analytics. Start with the Instagram lead analytics workflow or Instagram lead capture.
Which Instagram DM automation metrics should you track?
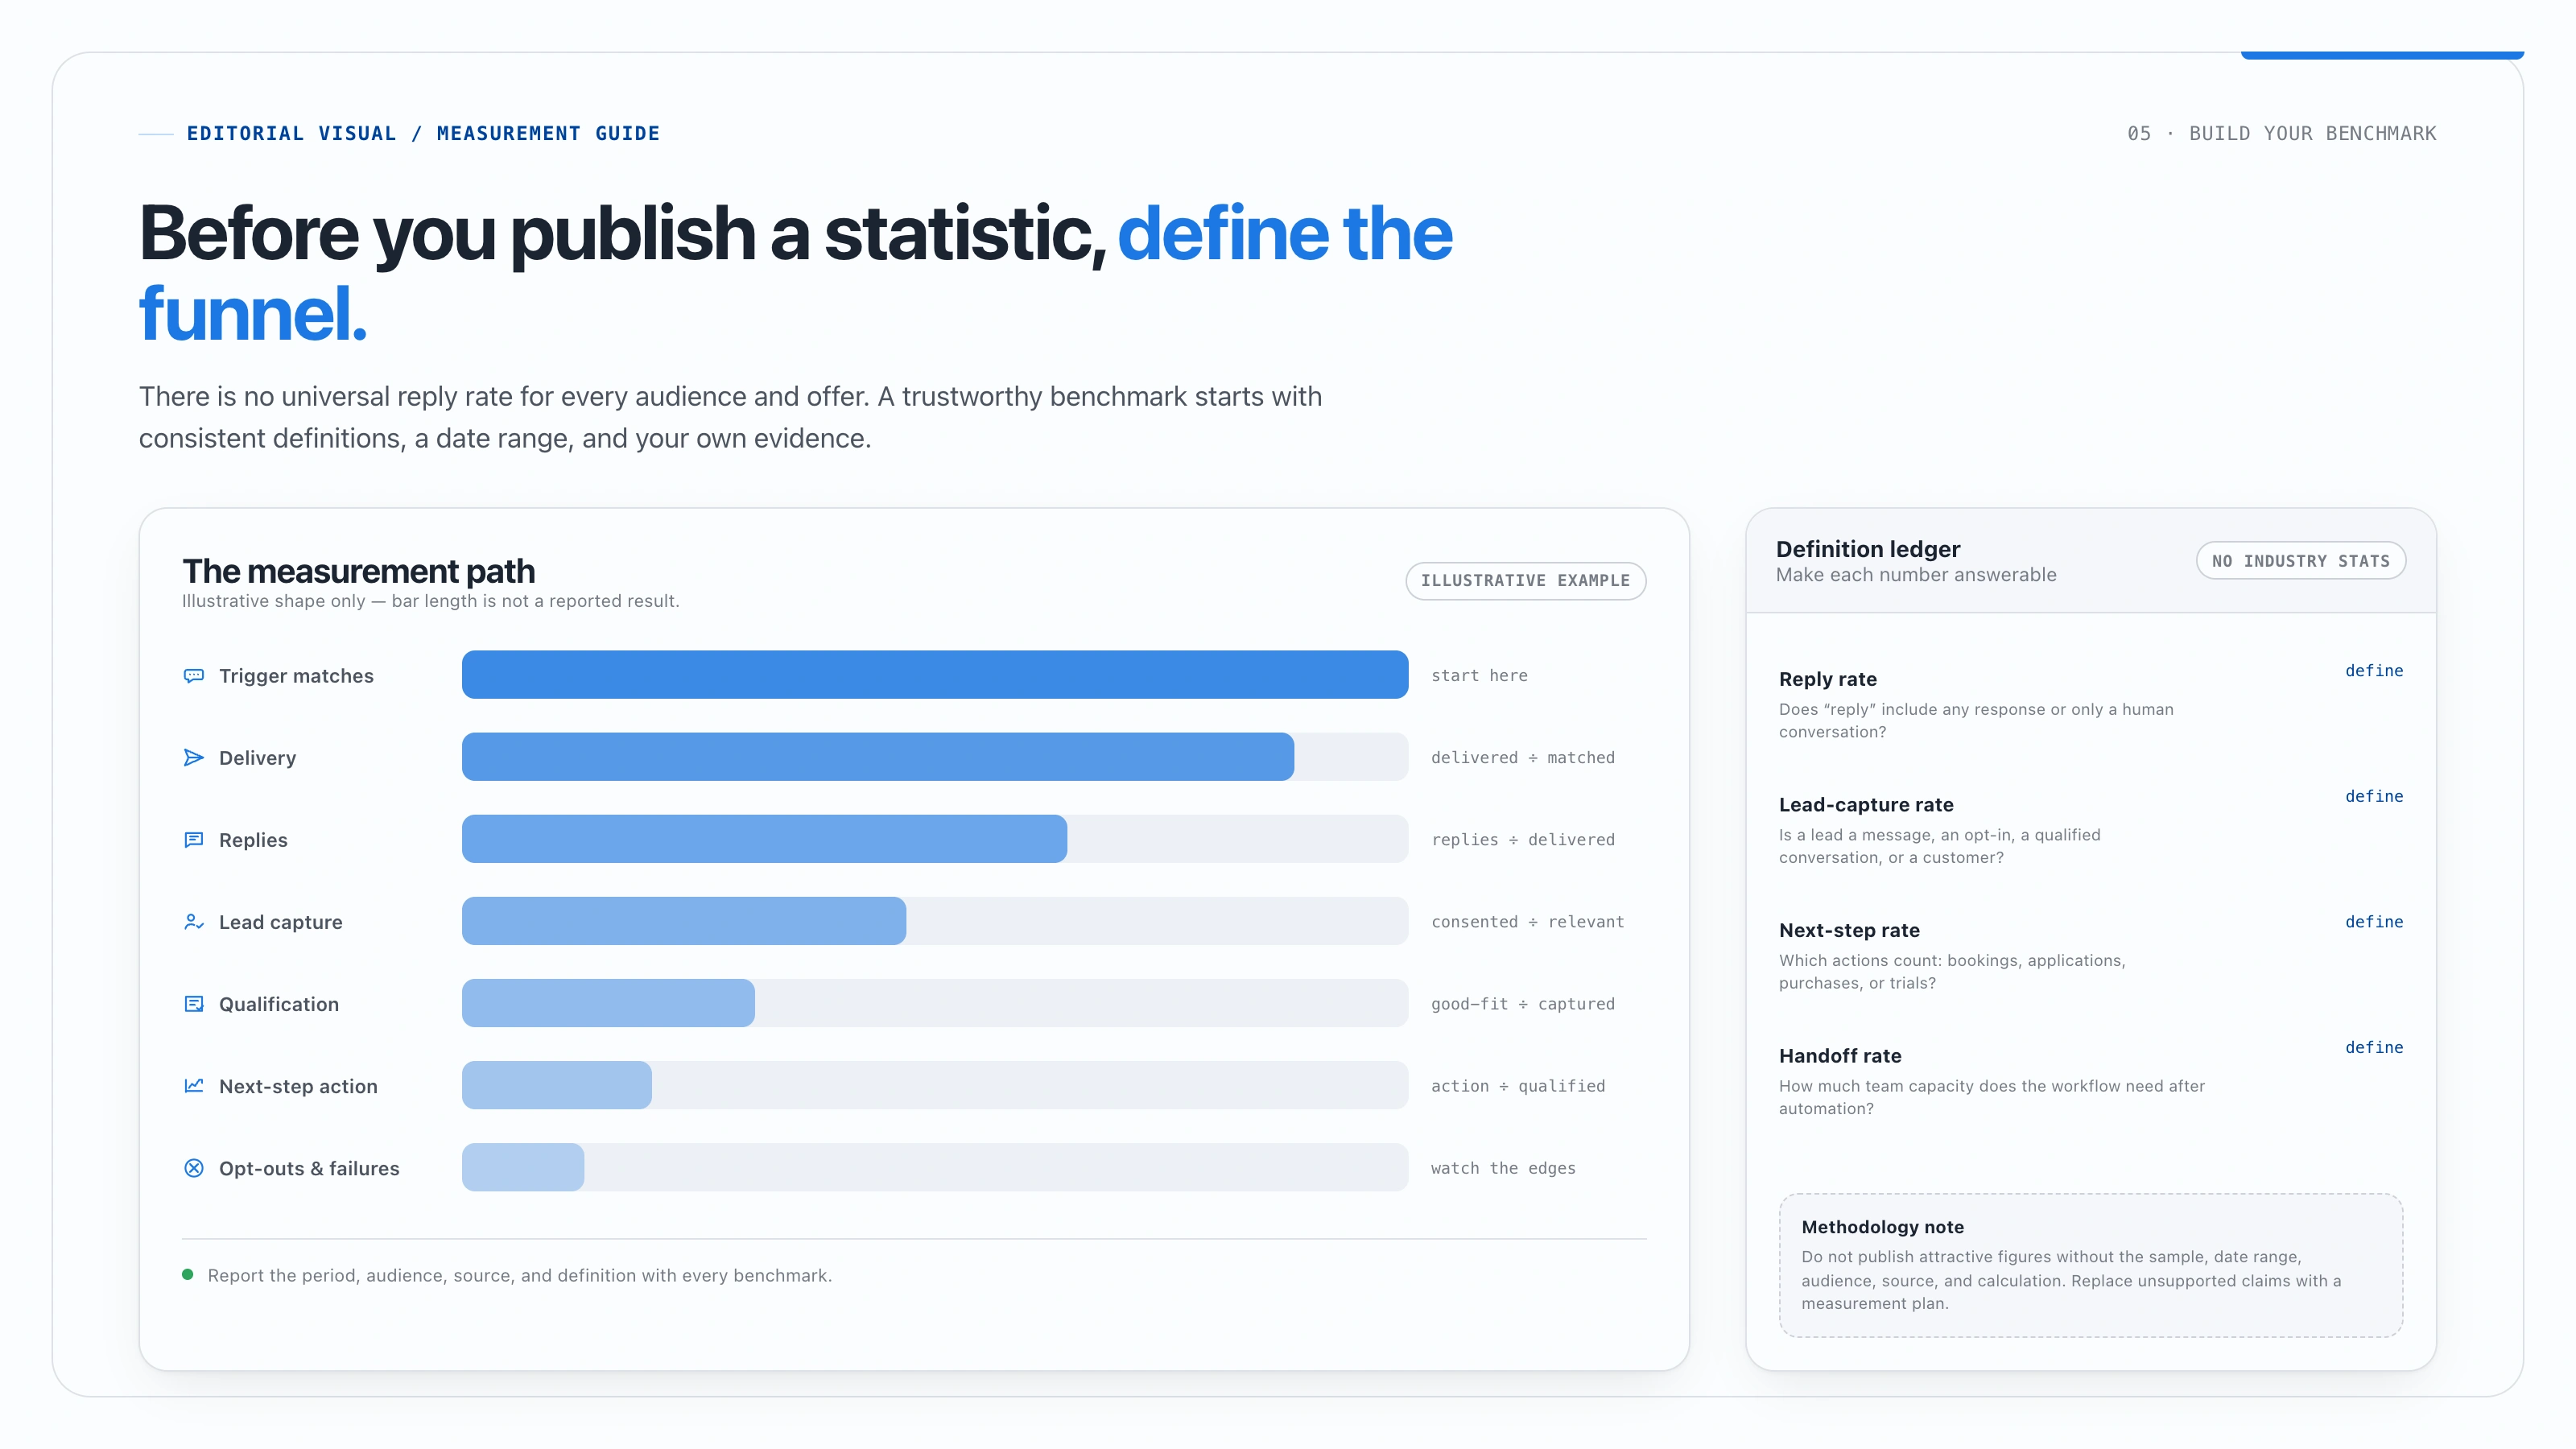
| Metric | Definition | Why it matters |
|---|---|---|
| Trigger matches | Interactions that match the intended rule | Shows whether the CTA and keyword are clear |
| Delivery rate | Messages successfully delivered ÷ matched triggers | Separates workflow demand from delivery issues |
| Reply rate | Replies ÷ delivered messages | Shows whether the message starts a conversation |
| Lead-capture rate | Consented leads ÷ relevant conversations | Shows whether the workflow creates usable records |
| Qualification rate | Good-fit conversations ÷ captured leads | Measures lead quality, not just volume |
| Next-step rate | Bookings, applications, purchases, or trials ÷ qualified leads | Connects the workflow to a business outcome |
| Human-handoff rate | Conversations routed to a person ÷ conversations | Helps plan team capacity and message boundaries |
| Opt-out and failure rate | Stops, complaints, or failed deliveries ÷ sends | Flags relevance, consent, or technical problems |
Define each metric before you publish it. “Lead” might mean a message, an email opt-in, a qualified conversation, or a paying customer; those are not interchangeable.
Why are generic Instagram automation benchmarks risky?
Performance changes with the offer, audience relationship, content format, trigger wording, account history, seasonality, platform behavior, and follow-up quality. A statistic without its sample size, date range, audience, definition, and source cannot tell a reader whether it applies to them.
Avoid publishing claims such as “automation increases conversions by X%” or “messages are opened Y times more than email” unless the exact source and method are available. Replace unsupported figures with a measurement plan or a clearly labeled illustrative calculation.
How do you build an Instagram DM automation benchmark?
1. Define the unit of analysis
Choose a campaign, post, story sequence, or date range. Do not combine a high-performing launch with ordinary weekly activity without labeling the difference.
2. Define the audience
Record the account type, audience or niche, geography when relevant, paid versus organic source, and whether the person had already interacted with the business.
3. Define the workflow
Record the trigger, message version, offer, qualification question, follow-up timing, stop condition, and human handoff rule.
4. Capture the complete path
Record trigger matches, delivery, replies, consent, qualification, booking or purchase, and opt-outs. A high reply rate with no qualified next step is not necessarily a successful campaign.
5. Report the period and sample
Show the date range, number of interactions, number of messages, and number of completed next steps. If the sample is small, say so and avoid broad conclusions.
What does a useful weekly report look like?
| Section | Example contents |
|---|---|
| Campaign | Post, Reel, Story, or Live name and source URL |
| Audience | Niche, market, and new versus returning conversations |
| Offer | Resource, booking path, product, or question answered |
| Funnel | Matches → delivered → replies → leads → qualified → next step |
| Quality | Common questions, human handoffs, opt-outs, failed sends |
| Decision | Keep, rewrite, retarget, pause, or test a new offer |
Report absolute counts alongside rates. A rate without its denominator can make a tiny sample look more conclusive than it is.
What platform data should you verify?
For account permissions, message behavior, and supported Instagram integrations, consult Meta’s Instagram Messaging API documentation. For account and content performance, compare operational lead data with native Instagram Insights rather than treating one system as a complete replacement for the other.
If you collect email addresses or phone numbers, document the purpose, consent language, retention, and deletion process that applies to your audience and jurisdiction.
How can SocialGrow help measure Instagram lead generation?
SocialGrow’s current marketing and help content describes lead capture, workflow/source attribution, follow-up, a shared inbox, analytics, and CSV export. Confirm the exact metrics and limits available in your workspace on the lead analytics page and pricing page.
Use the product to answer practical questions:
- Which content starts the most qualified conversations?
- Which keyword or story prompt creates the clearest next step?
- Where do people stop replying?
- Which leads need a human handoff?
- Which source produces trials, bookings, purchases, or customers?
How should you present SocialGrow’s own data?
Use a methodology box with:
- Source and collection method.
- Date range.
- Number of accounts or conversations.
- Inclusion and exclusion rules.
- Metric definitions.
- Limitations and known gaps.
An anonymized range is acceptable when customer privacy requires it, but it must still be real and explained. A hypothetical scenario should be labeled Illustrative example—not customer data. Never turn an example into a testimonial, benchmark, or customer result.
What are the most common reporting mistakes?
- Treating messages sent as leads generated.
- Reporting a rate without a denominator.
- Mixing paid and organic traffic.
- Presenting an isolated success as a typical result.
- Using competitor or industry data without a primary source.
- Ignoring failed delivery, opt-outs, or human handoffs.
- Measuring follower growth while overlooking qualified conversations.
How this statistics guide was prepared
This article intentionally avoids unsourced market-size, open-rate, response-time, and conversion claims. It treats original SocialGrow data as valuable only when the method is transparent and the result is reproducible. That standard makes the eventual report more useful to readers, customers, and answer engines.
For implementation examples, read the complete Instagram DM automation guide, comment-to-DM lead generation guide, and Instagram auto-reply tools comparison.
Ready to connect Instagram conversations to measurable lead follow-up? Create your first SocialGrow workflow or start a trial.
Related Articles
4 Best Instagram AI Chatbots for Sales (2026), Ranked
Our ranked Instagram AI chatbot picks for sales and lead qualification, compared by channel support, knowledge, actions, handoff, and setup.
automation5 Best Instagram Comment-to-DM Tools, Ranked (2026)
See five ranked Instagram comment-to-DM tools for 2026, compared by trigger fit, first reply, lead capture, plan limits, and handoff.
automation5 Best Instagram DM Tools for Coaches (2026)
Our ranked Instagram DM tool picks for coaches, compared by lead magnet delivery, contact capture, follow-up, channel mix, and plan limits.
Ready to automate your Instagram engagement?
Turn every comment into a conversation with SocialGrow.
Start Free Trial7-day free trial · No credit card required